How it's made
The techniques behind the films
Every frame is built from evidence you can check. These are the techniques we use.
- 01
Maps built from survey data
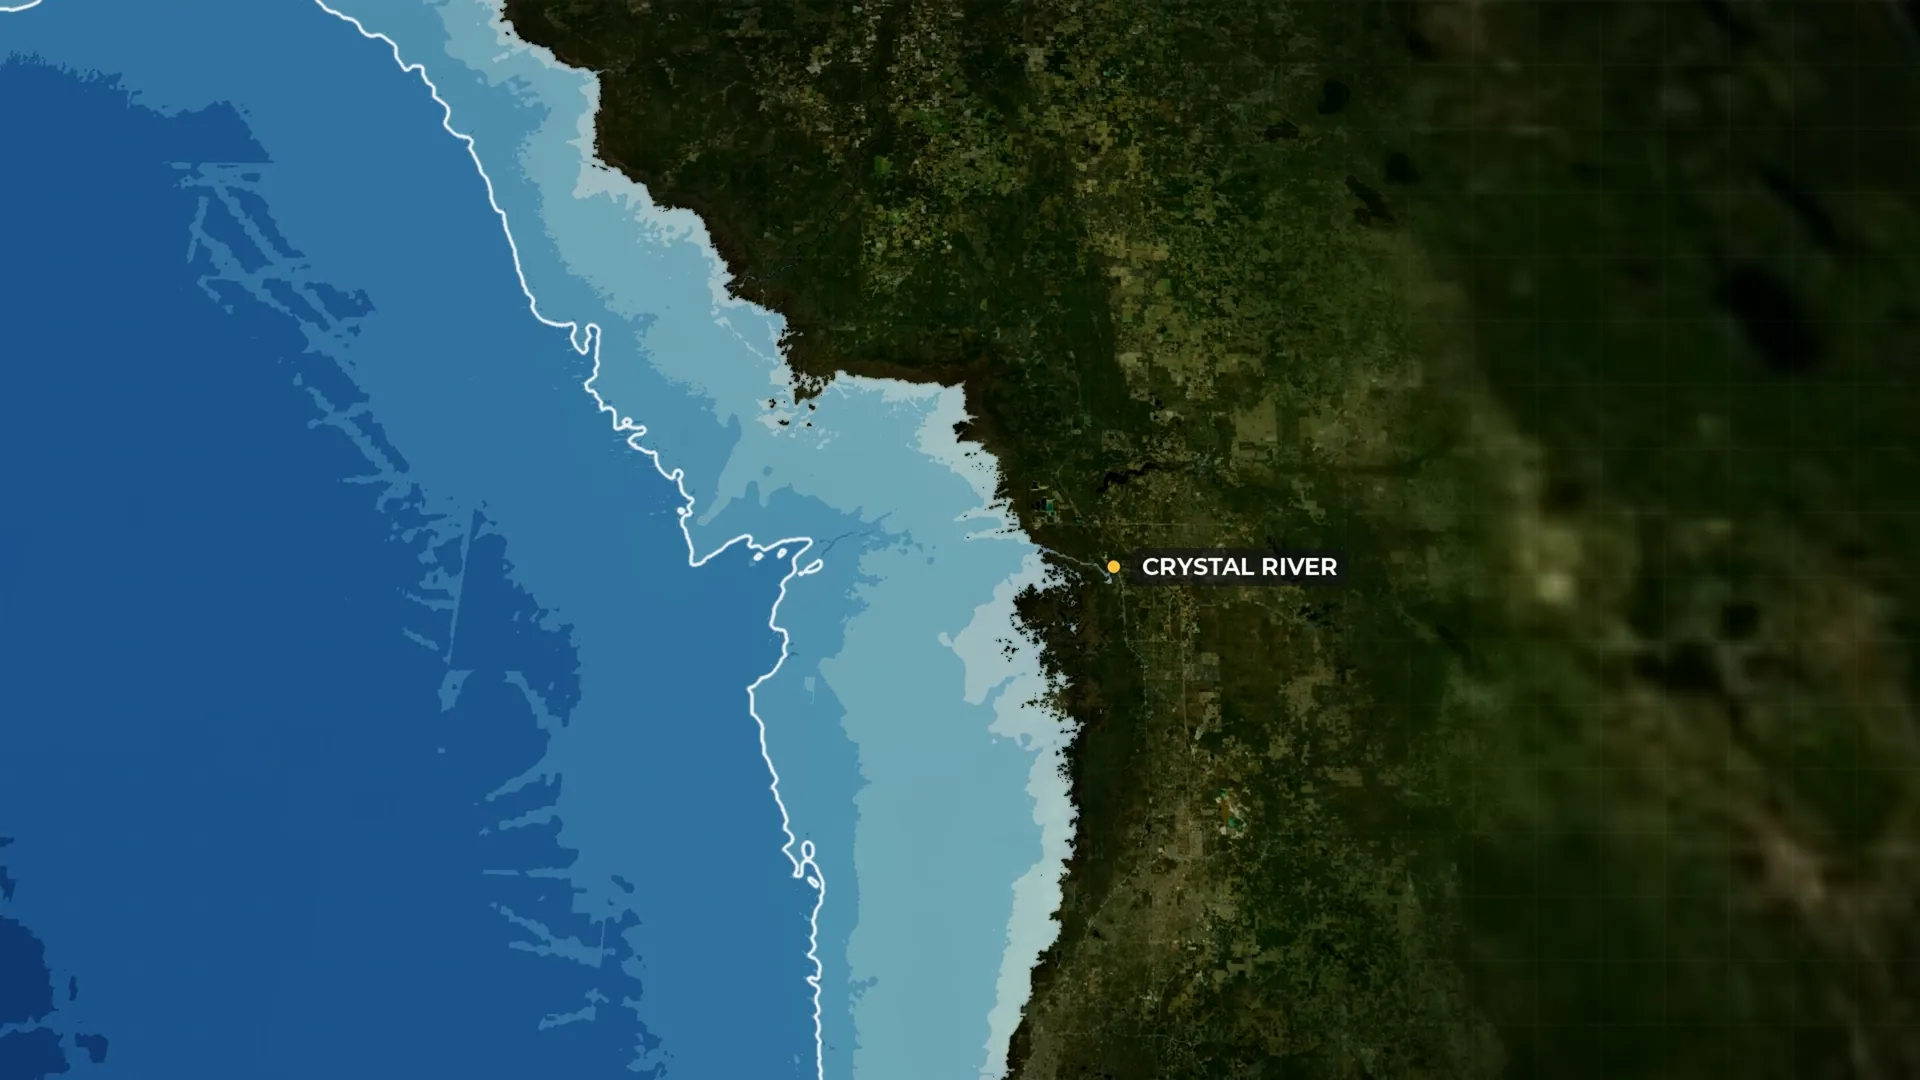
Every map is rendered by our own software from the agencies' published data: elevation models for the land, survey grids for the sea floor, aerial and satellite imagery for the surface, census counts for the people. When a film says the water is a foot and a half deep three miles out, the colour on screen is that survey's number at that spot.
- 02
Every number from the primary record
Figures come from the records themselves: census counts, survey charts, tide and stream gauges, geologic maps, treaties, railroad charters and old newspapers, from public archives such as the National Archives, the Library of Congress, USGS, NOAA and the Census Bureau. Each one is checked against its source, and every film lists them all.
- 03
The real page, not a retyped quote
In our newer films, when a film quotes an old record, you see the scanned page itself, with the passage highlighted as it is read, and the full source underneath.
- 04
Names said the local way
The narration is a synthetic voice. Since our third film, every place name has been checked against how local people say it (local news, local officials, the Texas Almanac) before anything is recorded. For the first two films, viewers corrected us, and those corrections are listed on each film's page.
Where the data comes from
The datasets behind the films
All public, mostly from federal and state agencies. Each one is credited in the film it appears in.
Land and sea floor
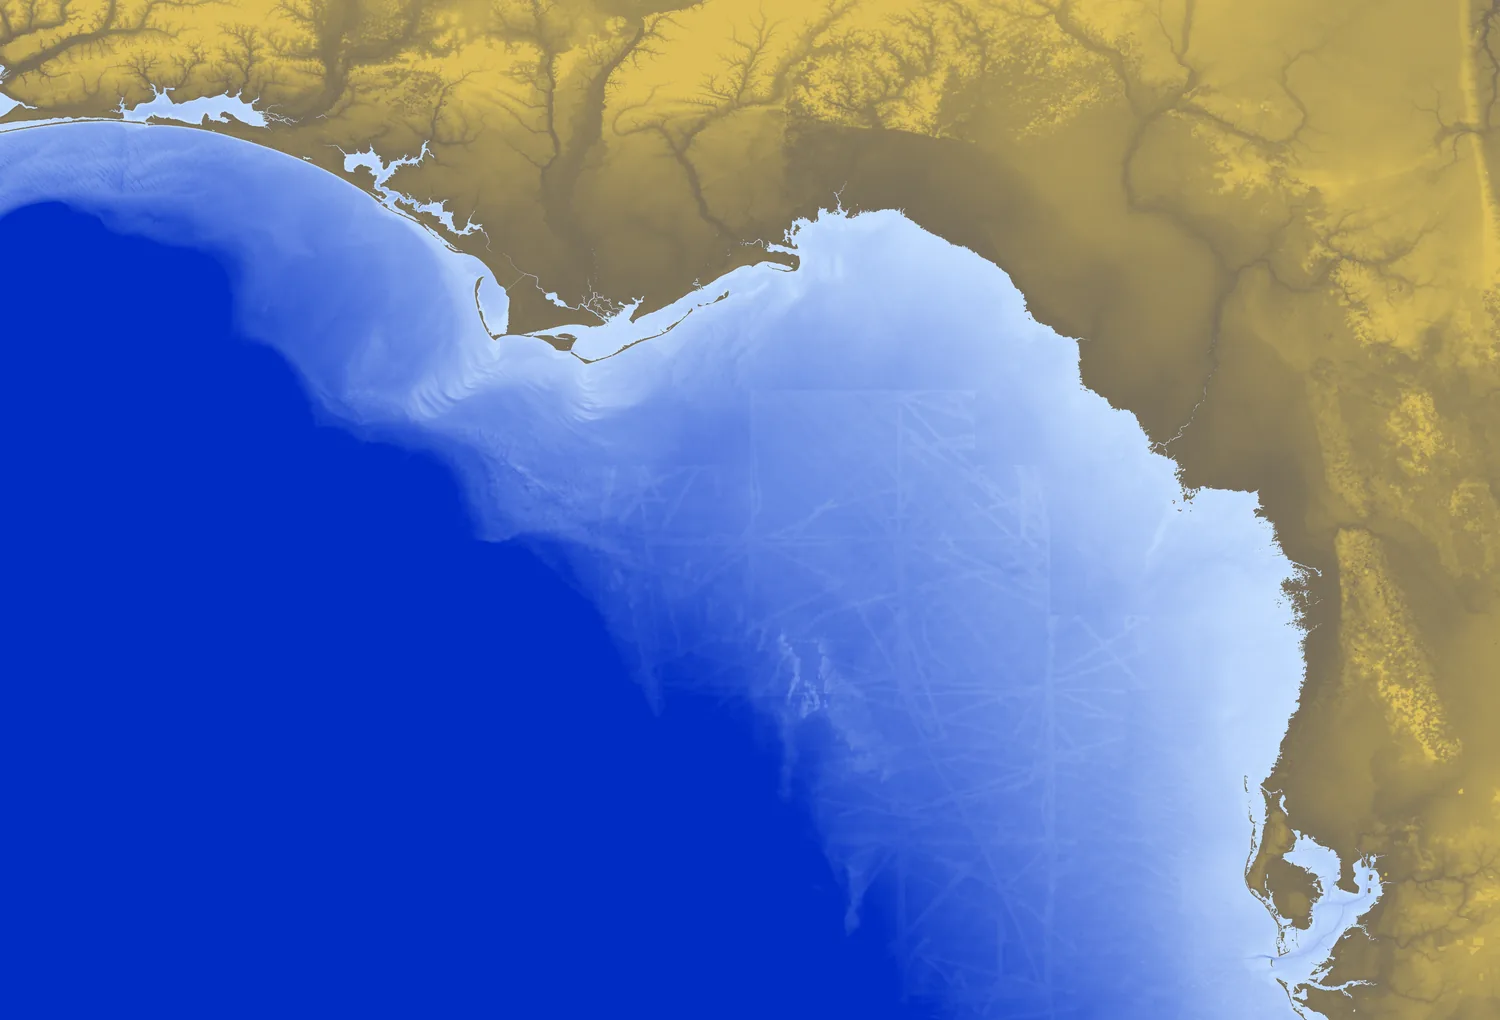
- DEM Global Mosaic / CUDEMNOAA National Centers for Environmental InformationThe sea floor of the Gulf: the shallow shelf and the depth at every point off the coast.Big Bend
- 3D Elevation Program (3DEP)U.S. Geological SurveyThe relief of the Balcones Escarpment and the Hill Country.Balcones
- Shuttle Radar Topography Mission (SRTM)NASAThe Rocky Mountain front, measured from orbit.Front Range
From above
- National Agriculture Imagery Program (NAIP)USDA, via the USGS National MapAerial photographs of the ground, close in.Big Bend, Balcones
- Blue MarbleNASAThe whole-country daytime view.All three
- Black MarbleNASAThe night lights that show where people live.All three
People
- Decennial Census and population estimatesU.S. Census BureauWho lives where, down to the census block, and how towns grew.All three
Water
- Tide station 8727520, Cedar KeyNOAA Tides & CurrentsThe tidal range and the record storm surges.Big Bend
- Stream gage 08171000, Blanco River at WimberleyU.S. Geological SurveyHow fast the river rose in the 2015 flood.Balcones
- J-17 well and the artesian zoneEdwards Aquifer AuthorityWater levels in the aquifer beneath San Antonio.Balcones
- Aquifer extent and Report 345Texas Water Development BoardWhere the aquifer runs and how it behaves.Balcones
- Edwards Aquifer recharge zoneTexas Commission on Environmental QualityWhere rain soaks into the aquifer.Balcones
Ground and soil
- Level III and IV ecoregionsEPA and USGSThe line where the Hill Country meets the prairie.Balcones
- Soil surveyUSDA Natural Resources Conservation ServiceHow much water the soil holds, east and west of the line.Balcones
Maps, papers and places
- Maps, photographs and newspapersLibrary of CongressOld maps, photographs and newspaper pages, shown as the original scans, including the Sanborn insurance maps of Cedar Key.All three
- National Archives CatalogNational ArchivesPhotographs, footage and federal records.All three
- Florida MemoryState Archives of FloridaPhotographs of the Big Bend coast and its towns.Big Bend
- Handbook of TexasTexas State Historical AssociationFounding dates and the history of the towns.Balcones
- Natural Earth and OpenStreetMapNatural Earth; OpenStreetMap contributors (ODbL)Rivers, roads, railroads and borders.All three
An example · Florida's Big Bend
From a survey grid to a frame
The sea floor in the Big Bend film comes from NOAA's elevation and depth grid for the Gulf (public domain). On the left, the raw grid: land in tan, water from pale (shallow) to deep blue. On the right, the same ground as it appears in the film. The pale band hugging the Big Bend coast is the shallow shelf the whole film is about.